Satellite Images and Geographical Information Systems:The Tools of the Future
Chris Audroing(Computer Services,Training and Communications,Ltd.,Macau)
This paper deals with two key tools more and more used to help in population and development management. The first one concerns SPOT satellite images. The second tool is APIC: a Geographical Information System (GIS). APIC is designed quite explicitly for geographical business management, to help com-panies or governments to draw together often dispersed and incompatible cor-porate information, and to manipulate it in its spatial environment. The arti-cle shows how information gathered about population and develepment can be used for a wide range of applications.
Urbanization Trends, Patterns and Impacts
The State of Urbanization in Asia and the Pacific was prepared by the United Nations Economic and Social Commission for Asia and the Pacific (ESCAP) to serve as a basis for discussion at the Ministerial Conference on Urbanization in Asia and the Pacific (Bangkok, 27 October-2 November 1993). In this report the following data were given:
Between 1990 and 2020, the ESCAP region is expected to become predomi-nantly urban. The 1990 urban population of 991 million is projected to swell to 2.44 billion. The proportion of the region's urban population is expected to in-crease from 33 percent in 1990 to 55 percent in 2020.
The massive 1.5 billion net increase, which dwarfs China's 1990 population of 1.1 billion, has some serious implications. These relate to the sheer size and rate of the change, as well as to the geographical location. The increase implies the equiva-lent of the full establishment of a new city of 150,000 people every day for the next 30 years. If present densities are maintained, by 2020 urban areas will be two and a half times more extensive than they are now.
The bulk of the increase will occur in China (550 million), India (418 million), Indonesia (95 million), Pakistan (93 million) and Bangladesh (65 million). All but Indonesia are low-income countries. The greatest burden will thus be placed on those least able to bear it.
These figures, however, are estimates only. Urban areas are surprisingly diffi-cult to define and track, mainly because boundaries are generally drawn for ad-ministrative or political purposes rather than to reflect the realities of urban liv-ing; reclassification generally lags behind the fact. The extent of current urbaniza-tion, therefore, may well be strongly understated in available statistics. If this is so, the challenge ahead may be less daunting than suggested.
There is no denying that a massive, rapid demographic and development transi-tion -- the most dramatic ever witnessed by the world -- is nevertheless under way. Contrary to earlier views, the trend is now believed to be inevitable and unstoppable.
This view is supported by two recent conclusions: (a) economic growth and ur-banization are so strongly linked that, as development and the related transition from agriculture to industry proceeds, the region's cities will grow; and (b) sound empiri-cal evidence suggests that city growth cannot be restrained. All previous attempts, mainly through rural development schemes to reduce in-migration but also occa-sionally through out-migration programmes, have shown little result.
The key urban policy shift that is proposed, therefore, is from restraining to facilitating urbanization. This should allow the many serious problems facing Asian cities to be addressed. It is now argued that earlier policies actually contributed both to rapid urbanization and to city inequities. Facilitation, in contrast, would improve city links with the countryside, thereby helping to distribute urban ben-efits more widely, while at the same time fostering greater urban equity.
Many Asian cities already have severe problems. The acute shortage of land, shelter, infrastructure and services has led to massive, seemingly irreducible slums and squatter settlements, overcrowding and congestion, and serious environmental degradation. Land shortage has two fundamental causes: (a) agricultural land can-not be converted to urban use quickly enough to accommodate rapid city expansion; and (b) many urban regulations and standards tend to hamper efficient use of exist-ing land. These shortages are the underlying reason for inadequate shelter.
Across the region, some 25-35 percent of urban populations are thought to be squatters. But the proportion is much higher in some countries, particularly in South Asia. Almost one quarter of the region's urban population live in absolute poverty.
Apart from outright slums and squatter settlements, overcrowding is very common. The average number of people per habitable room ranges from 2.0 to 3.6. China has classified 15 percent of all its households as 'ill-housed'.
Only half the urban population in Asia have access to water supplies and only 42 percent to sanitation. These percentages vary greatly from country to coun-try and between cities, but in the slums they plummet to averages of 20 percent for water supply and 11 percent for sanitation.
Roughly half of all the solid wastes generated remain uncollected, lying on dirty streets, blocking drains, polluting water supplies and providing an ideal host environ-ment for disease. Most urban centres in Asia have no solid waste disposal system.
Demand for transport has outstripped road capacity and transport services in most parts of the region. Road congestion in many cities is now beginning to affect their efficiency and productivity. Peak hour traffic in Bangkok, widely per-ceived to be the worst-affected city, now moves at around 9 kms per hour, costing the city about one-third of its potential product.
The environment is seriously affected by all the above phenomena. Air, water and land pollution are severe and generally growing worse. A particularly serious issue is indoor air pollution, now recognized as a major health hazard for the poor.
Although facilitation can be expected to mitigate these problems, it clearly can-not take place within the same administrative framework that served urban restraint. Fundamental policy and institutional change is therefore essential if cities are to cope with both inherited problems and the even heavier pressures that the future will bring. The pace of urbanization over the next 30 years will be more than twice that of the past 20 years. If the previous administrative framework was already inadequate, then unless major changes are made, an urban future can only be bleak.
Basically, the region's cities have been hamstrung by too rigid a hierarchical legislative, regulatory and financial framework. The challenge, therefore, is to devolve government onto local institutions that have been given much greater administrative and financial autonomy and capacity, and that are in a position to foster public participation. And to do so, adequate tools must be available to help analysts, managers and decision-makers. Two of these are becoming very popu-lar, as their power allows acurate and fast conclusions to be drawn.
GIS and Satellite Images: Two Complementary High-Tech Products
Geographic information is becoming more and more important in developing as well as in developed countries. Consequently, within the last 5 years, the de-mand for GIS and satellite imagery has rapidly increased. For instance, according to a 1992 Daratech GIS market study, annual GIS growth (software, hardware and services) should reach 22 percent over the 1992-1997 period. This is a paradoxical situation, bearing in mind that satellite imagery and GIS have evolved separately, but several reasons can explain this. First, space images have been viewed for a long time either as beautiful color prints or as a high-tech and expensive tool used by specialists. Second, the difference between raster and vector data structure has been shown to be the major technical limitation. Third, a new technology was not well-accepted within the GIS community. However, from a technical and economic point of view, there is a real synergy between GIS and space imagery.
On the space remote sensing side, GIS represents a fabulous opportunity to fully exploit the potential of satellite images. First, because integration into large data bases multiplies the applications. Second, because GIS data of GIS specific tools (spatial analysis and output facilities) allow one to extract more accurate information from the images. Moreover, this information can be more easily inte-grated into classical decision-making tools. Third, satellite imagery suppliers can take advantage of the widespread GIS commercial network.
From a GIS point of view, when considering the enormity of the task of building vector data bases, it has become obvious that satellite images are a very interesting alternative to decrease data acquisition costs and delivery time and to improve updat-ing operation frequency, especially when basic geographic data are poor or not accu-rate enough. In this case, satellite images can be used as a cartographic reference.
Fortunatly, a certain change of emphasis has occurred over the past four or five years, and integration between GIS and satellite imagery is now increasingly obvious (Ehlers 1989, Goodenough 1988, Trotter 1991, Williamson 1988). Several technical and economic problems are being resolved (Maffini 1987), and should lead to a bright future for both products.
Satelite Imagery: One Example of a Civil Observation Satellite
Launched in 1986,1990, and 1993 by the French Ariane rocket, SPOT satellites have been observing the earth, collecting data, providing perspective views of relief and surveying the earth's surface in multiple ways.
One imagines looking at the earth from 830 km above the ground, seeing riv-ers, mountains, forests, agriculture activity, towns and a mass of other detail.
SPOT Satellites are so accurate that a North American Intelligence Agency is one of its very first clients, even though SPOT is a civil observation satellite. Ob-servations are available to anyone, and SPOT satellites are the only ones so flex-ible that they can be programmed to meet any private request.
Because of this, SPOT can adjust to particular subjects of interests ranging from demographic analysis help to development project site selection, siting of transport, oil pollution contingency measures, geological study, siting of fish farm-ing, agriculture, vegetation study, 3-D views and many others.
After seven years of operation, more than three million scenes have been ac-quired. SPOT 4 is scheduled to be launched around mid-1997. Current plans call for SPOT 5 to be ready in 1999 for a scheduled launch in 2000, and for Spot 6 to be ready in 2002 for a scheduled launch in 2005 or 2006.
SPOT 5 and 6 will be placed in the same orbit to provide continuity of SPOT data (same types of imagery as SPOT 4) while offering two important new capa-bilities: higher resolution (5m) and stereoscopy using along-track overlap, afford-ing greater flexibility than the current across-track method.
Geographical Information System: What Is a GIS ?
A GIS is designed quite explicitly for geographical business management, to help companies to draw together often dispersed and incompatible corporate in-formation, and to manipulate it in a spatial environment.
Intrinsically it sits as part of a wider information systems infrastructure, al-lowing companies to exploit their geographic data to the full.
First, software like APIC is an object-oriented database management system;alphanumeric data, graphical information and relations are all integrated into a unique structure. This object orientation reflects the intuitive view that users have of their working environment -- it is close to the natural way that their informa-tion is structured, so objects are familiar entities.
An object is the smallest entity managed within this type of GIS. But within this framework an object can refer to anything -- to a map, to other media types, or to complex compositions of text, graphics, images, relations and behaviour.
The object orientation drives every aspect of these GIS developments. As a result, they are easy to integrate with other applications, with external databases and processes; the object orientation gives application builders great flexibility and productivity, and this also minimises on-going systems maintenance.
Second is the element of space. They not only appear as a seamless database, but their objects are truly modelled in a spatial continuum, and this in itself is in remarkable contrast to many map and map-page-based GISs. The benefit is that applications can access objects without any spatial or scalar constraints.
The third key innovation in these latest GISs is their development language. The GIS language is the software developer's point of contact with the system. It allows the creation and manipulation of objects themselves and direct access to the database. The same language then processes these objects -- controlling their geographical characteristics or the optimum paths between points, for example, and handles classical algorithmic functions, too.
The result is a rich operational language which delivers a productive, simpli-fied development environment.
Architectures and Configurations
GIS like APIC, by its nature, is an open system; both the APIC databases and data model use a public interchange format. So, for example, it can provide on-line access to SQL relational databases, and exchange data with graphical or CAD systems.
The system has a true client-server architecture; it can be configured as a sin-gle or multi-user system, as a multiple database system -- where the user has access either to foreign or other APIC databases -- and as a multi-process system, which gives access to external processes, such as expert systems.
The system runs under Unix on a variety of high-performance workstations, including the HP 9000 Series 700, IBM RS6000, SUN Sparc, Digital and Bull RISC platforms, and Tandem Unix servers.
In addition, APIC conforms to X Windows standards. It is designed so that users can customise their own windows, multiple screen windows, menus and messages. In fact, APIC has been installed in a client server configuration on X-based personal computers and X-stations.
Some Applications of Urban Management in Action around the World
The urban fabric of developing countries tends to change very quickly due to the high rate of population growth. This complicates scheduling, particularly forcensus operations and their updating. To increase the frequency of census taking and to facilitate the work involved, research teams have developed new methods based on sampling techniques. To be efficient, the sampling technique must, how-ever, be based on the latest and most detailed land use map. In many countries, this type of map is either non-existent or out of date. SPOT data (overall, repeti-tive view, etc.) constitue an ideal information source for sample-based demographic surveys. The sample base (geographic area considered) can be delimited, strati-fied and updated by detecting changes in the urban fabric. Validated by ORSTOM in the case of Quito, the procedure can now be applied by statistics-gathering in-stitutes in other towns.
Quito, the administrative capital of Ecuador, has a population of 1,120,991. Quito extends over some 50 kilometers running north-south and is situated on the slopes of the Pichincha volcano (altitude 4550 m), whose snow-capped crater can be seen to the west.
Delimiting the sample base:_This operation uses digital processing to distinguish the different town infrastructures: buildings, open spaces, road systems, etc.
For purposes of comparison, the red line (see photo 1) was drawn from the interpretation of aerial photographs (1:40,000). It can be seen that the limit visu-ally identifiable on a SPOT panchromatic print closely matches that established from the aerial photographs.
Stratification of the sample base:_Stratification of the space established from a SPOT scene leads to a 50 percent increase in accuracy of demographic data.
Updating the sample base: Some small-scale construction changes can clearly be detected by comparing two SPOT panchromatic scenes. A colour composition (i.e., June in blue, November in red; see photo 2) provides an easy means of iden-tifying all new structures that have appeared within the previous six months (in red). Changes in urban fabric can therefore be tracked and a sample base updated from the SPOT images.
The image (see photo 3) shows the town's historical centre (dark blue), the airport runway (in black), and the various parks and gardens in the town centre (in red), along with recent extensions (in light blue or white) to the north and south of the town.
The 1992 Winter Olympics, Albertville, French Savoy: Thirteen core sites spread over some of the least accessible winter mountain scenery in Europe, and home for two weeks to 40,000 athleles, volunteers and visitors. A logistical nightware if ever there was one, and an accident waiting to happen under the glare of the world's media. But it did not -- thanks in part to an innovative application of APIC.
Water distribution systems at the games were managed by Lyonnaise Des Eaux Dumez, and it developed a critical water quality and crisis management system --Plan Secours -- to handle any possible pollution of or disturbance to the water sup-ply. In essence Plan Secours comprised an APIC database of the Albertville water network driven by an exteral expert system. The system was able to alert network operators of potential trouble spots, evaluate risk, and determine crisis management.
Three points are significant here. First, APIC was used successfully in a highly exposed environment. Second, the Albertville project underlines APIC'spenetration of and status in the water industry across Europe. Third, and most important, the application points to one facet of the future of space within information systems. Here APIC was a slave to a sophisticated expert system.
Operational management of water network: North-East Water was formed by the amalgamation of the Newcastle and Gateshead and Sunderland and South Shields water companies. Together they serve 1.3 million people in an area of over 5,000 sq km through a 7700 km distribution network, and APIC has been an invaluable tool in building a new and competitive organisation.
David Shore, strategic planning and information technology manager at North East Water, says that both of the original water companies had been interested in digital mapping "for years but had fought shy of its expense. But," says Shore, "water privatisation in the UK and the institution of a new water regulator, OFWAT, changed the equation."
The system is being installed by The APIC Partnership, with Capita concen-trating on business analysis and the SEMA Group handling technical develop-ment, both supported by APIC Systems UK.
Initially the partnership helped North East Water to develop a vision for GIS within its business, and to build a specialist team responsible for delivering busi-ness-led applications.
The subsequent implementation strategy encompasses regional perform-ance analysis, network management and customer service. Currently the project has two main parts: a data capture exercise -- the whole of the former Sunderland network has now been digitised and is managed with GIS-based maps -- and the development of GIS applications and their bridges to other corporate systems.
"But," says Shore, "it is hard to predict the final scope of our GIS work. We are still learning what the possibilities are, and there is no doubt that we hope for great things. The systems will certainly revolutionise the way we handle informa-tion and will become a preferred way of accessing information about and manag-ing our corporate resources. In the short term, it allows us to present information, especially technical information, spatially in ways we could not before, but ulti-mately the system will impinge on every area of the company -- not just on tech-nicians with assets to manage on the ground -- and eventually it will help even our accountants. It will become North East Water's way of looking at the world --our corporate window."
APIC's credibility in water and associated industries is not in doubt. Water companies from Paris to Barcelona -- the likes of Lyonnaise des Eaux Dumez, Societe Parisienne des Eaux, and Sociedad General de Aguas de Barcelona -- to Macao and Yemen manage their networks with APIC-based GISs.
Similarly, in the UK, Essex Water is committed to the system, while North East Water, again in partnership with Capita and APIC, is sponsoring the development of a network corrosion analysis system with the Soil Survey and Land Research Centre, part of the Cranfield Institute of Technology.
Professor Peter Bullock, director of the centre, says that, eventually, the project, which is laying North East Water's network data onto Cranfield's own land infor-mation system, will enable the company to predict network degradation.
Courly, which administers the 55 municipalities of Lyon (France) and its environs, has developed a city planning and management system, which con-stitutes one of the most ambitious and far-reaching GIS applications ever en-visaged.
The scale of the project is quite staggering. It takes in urban planning, water, sewerage, roads, parks, education, and the provision of urban services, including the police, fire brigade, public transport and refuse collection. As such it is critical to Courly's ability to support a population of over 1.2 million, and to meet obliga-tory urban service standards.
The project, which began in 1987, has brought together vast amounts of often dispersed and incompatible sets of data from the region's different departments and services into one coherent integrated set. In fact, Pierre Pijouriet, the driving force behind Courly's urban reference system, comments that, "The GIS has been a catalyst to organization synergy and the effective use of corporate data."
As a result, the system, implemented on a central database server and avail-able across a network of some fifty workstations, has become the heart of Courly's administration.
Of course, APIC is not confined to vast undertakings such as Courly's. The French town of Frejus, in contrast, has developed its own innovative applications -- to analyse the use of parking meters or the locations of archaeological sites, for example -- without the support of information tecnhology specialists.
AREA, Societe d'Autoroutes de la Region Rhone-Alpes, a French highway management group, uses APIC to run some 500 km of highway and to report to French transport authorities. Superficially, that is a highly conventional GIS ap-plication. What is imaginative is how AREA uses its highways data.
Not only has its system given AREA a reputation as one of the most competi-tive and sophisticated road managers in France, but it can now analyse a wealth of highway statistics -- plotting accidents against weather reports and road main-tenance records -- to improve the quality and safety of its road services signifi-cantly, and it proposes, eventually, to link that information to its highway traffic displays.
But most conspicuous among the new generation of APIC applications is build-ing management.
Digital Europe is using APIC at the heart of its CABLE-manager, the first major application in its Building Integration Services Portfolio, BUILDING manager. Digital says it selected APIC because of the power and flexibility of its object-oriented, spatial database -- no mention of geography or mapping -- and that is the future for APIC and GIS.
Yverdon (18,000 inhabitants, Switzerland): The town of Yverdon has control of all its utilities -- gas, electricity, water and sewage. The technical department of the town is responsible for the operation and maintenance of these utilities. Since 1992, APIC has given the town the ability not only to perform its tasks, but also to benefit from the centralised management of the different networks. For this type of client, the "client-server" architecture of APIC is of particular interest, as it al-lows different technical departments to share data.
Digital Equipment Corporation (intelligent building management, USA/Europe):The DEC site division of Digital Equipment has recently launched a service pack-age called "Intelligent Building Facilities Management." Two key components of this package are "CableManager" and "BuildingManager," both applications built with APIC. The applications are integration platforms for data and applications, as well as other software, such as BMS (through a software bus [Bstar]) or infor-mation technology management tools, such as the network supervisor DECmcc). The first installations of CableManager and BuildingManager are in Germany, Fin-land, Denmark, Portugal and France.
SMEG (30,000 inhabitants, Monaco): The small residential Principauté of Mo-naco is a densely populated area, where urbanism is tightly controlled and con-struction extremely active. It was, therefore, imperative for the SMEG to manage the operation and maintenance of its gas network effectively and precisely. They chose APIC for this purpose. The first stage of the project is now completed, with the installation and operation of 5 DIGITAL and SUN workstations. SMEG is now in the process of connecting the geographically-based information system to its customer service data base.
Urban Community Of Lyon ( 55 communities, 2.5 million inhabitants; 350,000 par-cels -- France): The Urban Community of Lyon (COURLY) is certainly one of the largest and most advanced urban centres in Europe. It makes use of applications related to urban planning, cadastre and network management, and the SUR (Système Urbain de Reférence) Department encompasses the entire region of LYON (550 km2).
Courly makes particular use of the distributed data base mode in APIC to link its 62 workstations, which are used simultaneously by the Urban Commu-nity, the City of Lyon, utilities and the cadastre administration.
Frejus (45,000 inhabitants: France): Located on of the Mediterranean, with a population which varies from 45,000 inhabitants to 4 times that number, Fréjus is a town where achieving a precise grasp of the population and cadastral data was vital. Once this work was completed with APIC in 1992, many of the town's tech-nical departments began to see the benefits which could be derived from the sys-tem. Today Fréjus has developed a new set of applications to manage areas as diverse as archaeology, parking spaces and financial management. These applica-tions were developed by town employees thanks to the easily accessible develop-ment language of APIC.
Belo Horizonte (6 million inhabitants: Brazil): When the city of Belo Horizonte first considered APIC, it had an extremely ambitious plan -- to update the fiscal archives and systems of the city, based on new geographical information.
Within 12 months they had succeeded in efficiently acquiring more than 1 Gbyte of vector data, part of which information came from surveyors, and part from digitisation of scanned maps with APIC. Several hundred of these scanned maps were used, and the work was divided into 3 shifts. One year on, the city has signed major data exchange agreements with all major utility companies, as well as transport companies, the fire brigade and police force. Thanks to APIC, Bello Horizonte is becoming an operational model in South America.
North East Water (United Kingdom): North East Water has embarked on opera-tional GIS in order to improve its service to customers and gain real control overits dispersed asset base. The area concerned is approximatively 5,000 sq km, one of the largest in the United Kingdom, serving a customer base of 1.3 million peo-ple. By concentrating on applications, GIS will be in the forefront of the business, integrated with all the other strategy business systems. North East Water has in-stalled eight workstations and plans a further eight in 1993.
The 1991 Census in England: The decennial census is the most important and comprehensive source of data on the demographic, social, housing and employ-ment characteristics of the whole population. Martin Blogg (in GIS and the 1991 Census) explains from a geographical standpoint the planning base of the census, outputs which will be made available, examples of usage of the data and the po-tential for third-party "value added" census and related products. The geographi-cal unit for collection of census, data is the enumeration district (ED), which is of a size to provide a reasonable workload for a single enumerator. For the 1991 Cen-sus, each area will normally contain some 175 to 225 households. The boundaries of each ED need to be readily identifiable on an appropriate scale map, and sets of EDs must also aggregate to statutory boundaries, including wards, parishes (com-munities in Wales), districts, counties and regions. These constraints limit the flex-ibility for defining the boundaries, of each ED, but what flexibility remains has been offered to local authorities to design EDs to meet their particular require-ments. Some 200 authorities have taken up this offer. Thus the 1991 Census has entered the GIS age.
Conclusion
Numerous technical and economic reasons justify the integration between GIS and satellite raw or derived data. For the time being, SPOT data can be merged into medium-(l:20,000 to 1:50,000) to small-scale (1:100,000 to 1:250,000) GIS for cartographic or thematic applications. A new SPOT product line called "Geospot" has been developed, first on analog media and now on digital media in a specific format, easy to read on a GIS. To promote these data, SPOT IMAGE proposes glo-bal solutions to the customer (data-bases including the images and other types of data stored in a specific GIS Geospot format, hardware, software and services). This range of products will progressively be enlarged for specific thematic appli-cations. The improvements in the future SPOT satellites will also increase the in-terest of these data for GIS purposes. These efforts, combined with the improve-ments made by hardware and software designers, will greatly contribute to the use of geographic information among a growing user community, especially in relation to population and urban management. Figurel.Comparison between Aerial Photographs and SPOT Image
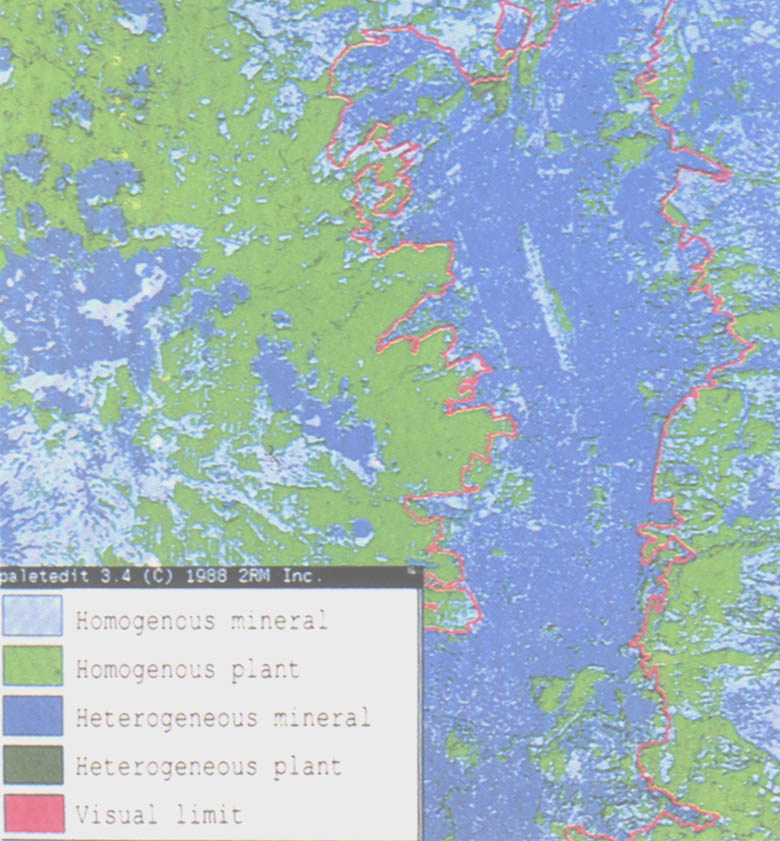
Source: Reprinted from Centre National d'Etudes Spatiales, SPOT Management and Decision Making Tool (France: Octobre,1989),p.26 by permission of the publisher.