Properties of corporate Betas in Hong Kong and Their Applications
Anthony Tam(Faculty of Business Administration) Chi Ma(Faculty of Social Sciences and Humanities University of Macau)
Beta has been used as a proxy for a firm's risk. According to the Capital Asset Pricing Model, the expected return can be determined if the firm's risk is known. This paper examines the beta properties of 110 Hong Kong listed com-panies for the period 1973-1986. Limitations of beta usage are discussed from a Hong Kong perspective.
Introduction
Investors anticipate a reasonable return on their investment. The higher the risk is, the higher will be the expected return. A lot of academic effort has been put into establishing the determinants of security pricing, or indirectly the ex-pected return on a security. The classical Markowitz Model1 offered an initial, struc-tured approach to portfolio selection in the context of diversification.
Markowitz demonstrated how to select portfolios on the basis of expected returns and risk. We attempt to minimize portfolio risk for a given expected re-turn, or we maximize expected return, holding risk constant. However, this is computationally very time-consuming in practice. For instance, 1,225 covariances need to be calculated if one were to consider 50 securities. The single Index Model (or the Market Model) of Sharpe2 and Fama3 offers an appealing alternative to explain the equilibrium return-risk relationship. It states that the return generat-ing process of security i is a linear function of the market portfolio return:
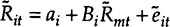
where
~~Rit is the return for asset i in period t.
~~Rmt is the return for the market index in period t.
ai and Bi are parameters specific to asset i.~~eit is a normally distributed error term with mean zero and a constant variance. These error terms are assumed to be serially uncorrelated.
Taking variance on both sides of the Market Model, we obtain the following risk relationship:

The left hand side of the equation, Q2 (~~Ri), is the total risk of return on asset i, which consists of two essential components:
[1.] Systematic risk, B2iQ2(~~Rm) -- There are in the market certain risk ele-ments that all assets are exposed to, although these risk elements may affect asset pricing by different extents as indicated by the value of the asset's beta coeffi-cient, Bi. Examples of systematic risk are political uncertainty in Hong Kong, strength of the US dollar, price of land etc. These risks cannot be diversified away if investing in a particular market alone. Investors will be compensated for under-taking these systematic risks. For those assets with beta values less than unity (sometimes called defensive stocks), the magnitude of the price movements are expected to be less than those of the stock market index (a widely used proxy for the market portfolio). For those assets whose beta values are larger than unity (sometimes called aggressive stocks), the magnitude of the price movements are expected to be more than those of the market index. For indexed funds, their beta values are equal to one by definition.
The beta coefficient of asset i can be estimated by using the Market Model equation:
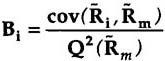
where
cov(~~Ri,~~Rm) = the covariance between asset returns and market returns.
Q2(~~Rm)= variance of market returns.
Beta is a common measure of an asset's systematic risk in a well-diversified portfolio. It indicates the amplitude of the volatility of the asset return with re-spect to changes in the market return. The market model has been rigorously tested using NYSE stocks by Blume4 and others. It provides a theoretical framework on which further capital asset models are based.
[2.] Unsystematic risk, Q2 (~~ei)-- these are risk elements specific to the firm or the firm s industry. Examples are patent or technology, expropriation, labour disputes, protectionism of foreign countries, and health of the company chairman. These risks can be avoided or reduced through diversification. Therefore, inves-tors will not be compensated for purposely taking the unsystematic risk or, in other words, they will not receive additional compensation for not diversifying their portfolio. Evans and Archer5 demonstrated that most of the unsystematic risk of a portfolio can be eliminated if one holds as few as 8-16 randomly selected stocks.
The Capital Asset Pricing Model (CAPM) attempts to offer a testable hypoth-esis in this risk and return relationship explored by the Market Model. The fol-lowing is the Sharpe and Lintner version of the CAPM:6
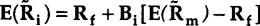
This model offers a relationship between expected return on the asset i and its systematic risk as measured by its beta coefficient Bi. The unsystematic risk is not included in the model because it is assumed that it can be eliminated by diversi-fication. The constant term is the risk-free rate, Rf, or return on the risk-free asset if such exists in the market (e.g., yield on Treasury bills or government securities).
Objective of Study
Many Macau firms have investments in Hong Kong stocks. It is the objective of this paper to estimate the beta values of 110 Hong Kong listed stocks which were continuously traded over the 1973/1986 period (refer to Table 1). This pe-riod covers two complete cycles of the stock market in Hong Kong. Macau inves-tors may perhaps be able to make better decisions if the statistical properties of these betas are known.
Method
The sample can be conveniently divided into three equal non-overlapping sub-periods of 54 months each. They are named as follows:
Sub-period #1 -- 6/1973 - 11/1977
Sub-period #2 -- 12/1977 - 5/1982
Sub-period #3 -- 6/1982 - 11/1986.
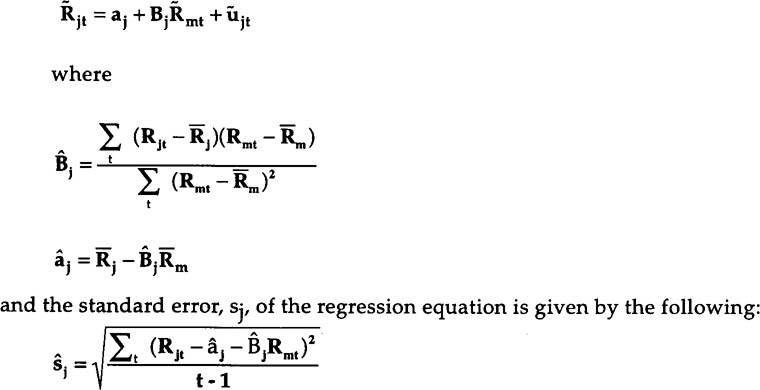
For every stock j in each sub-period, returns Rj are regressed upon the mar-ket returns, Rm, in order to obtain the beta coefficient of the stock, Bj. The Market
Table 1. Description of Sample
Sample Period: 6/1973 - 11/1986.
Sample Size per Security: 162 monthly returns.
Selection Criteria: [1.] Security must be continuously listed and traded
          for the entire Sample Period.
          [2.] Security must be listed in at least one exchange
          (4 during the period) in HK.
Number of Selected Securities: 110 stocks.
Basic Data Unit: Log returns adjusted for changes in capital structure.
         The quoted prices on the first and last trading days of
         the month are used to calculate return for the month.
Model equation is used to estimate the beta value of stock j:
Results
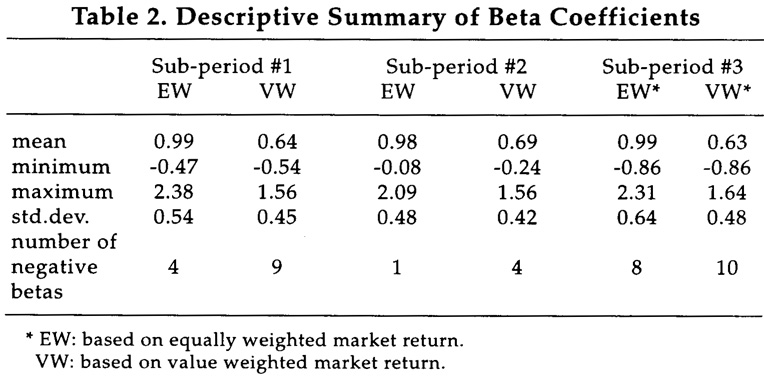
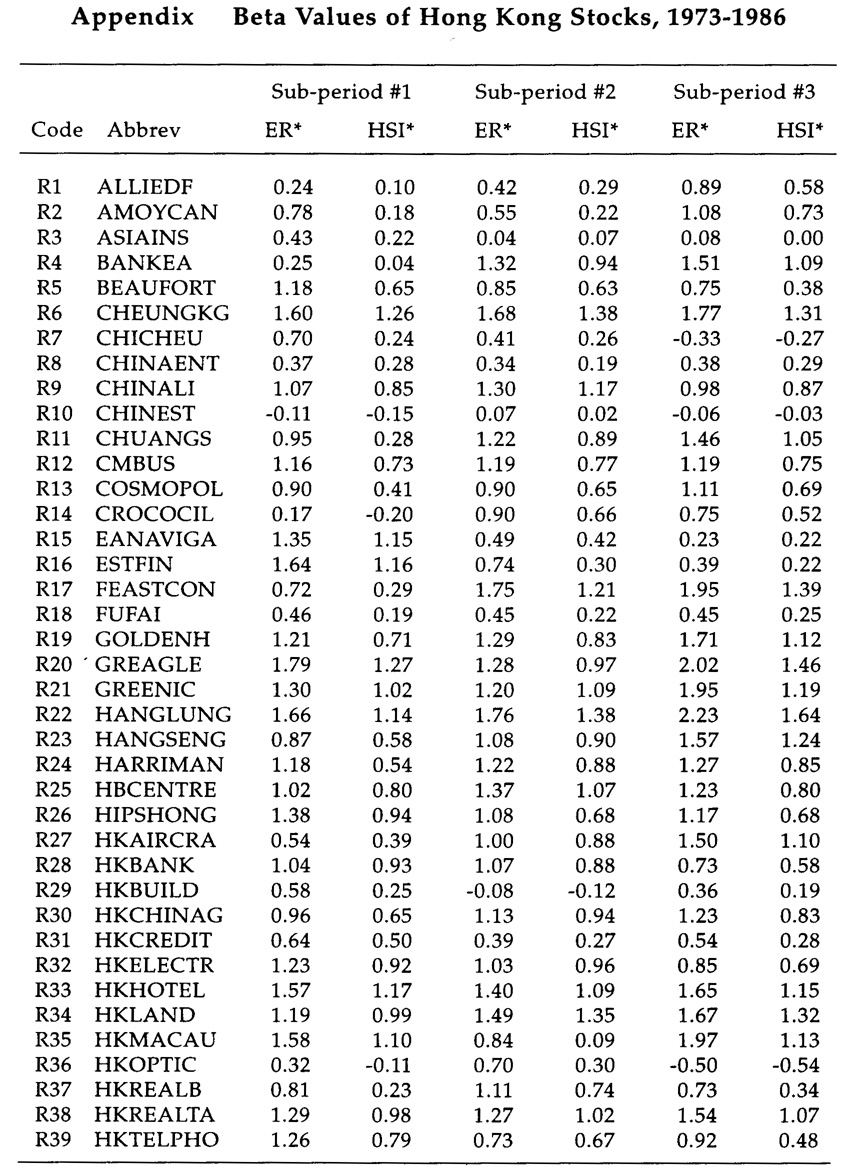
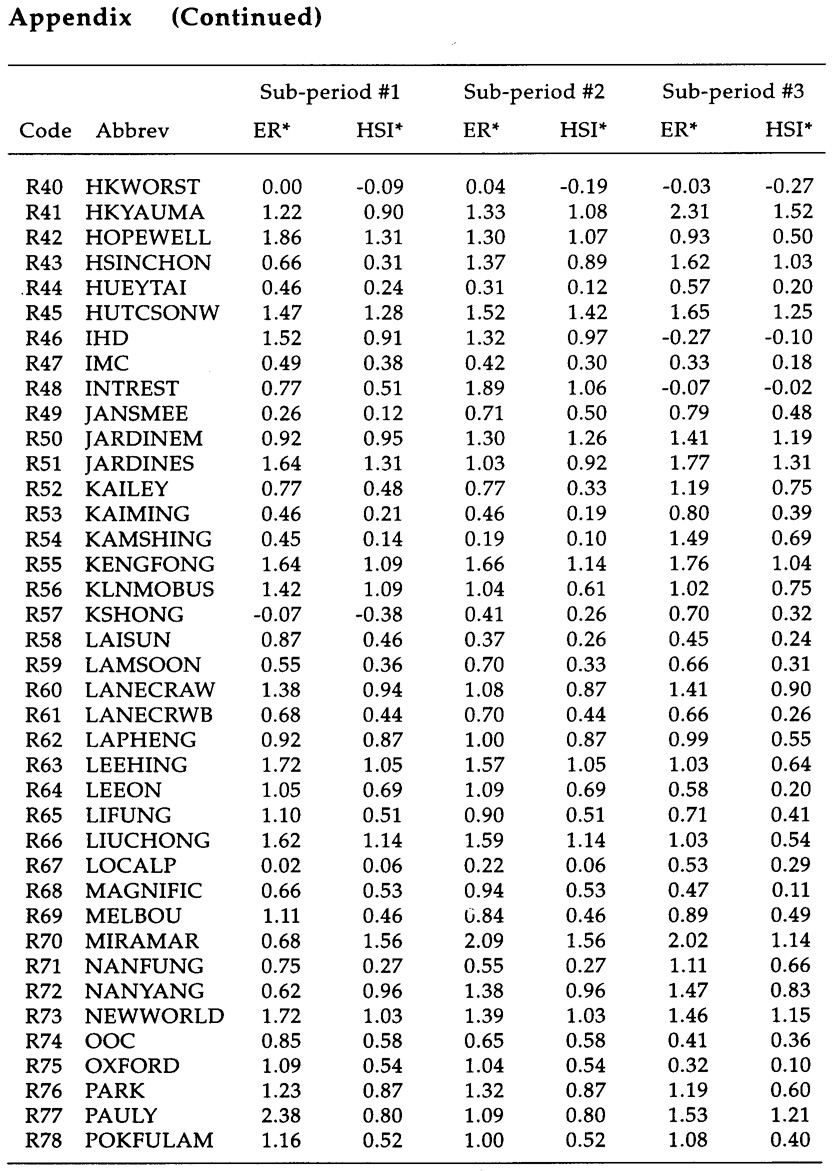
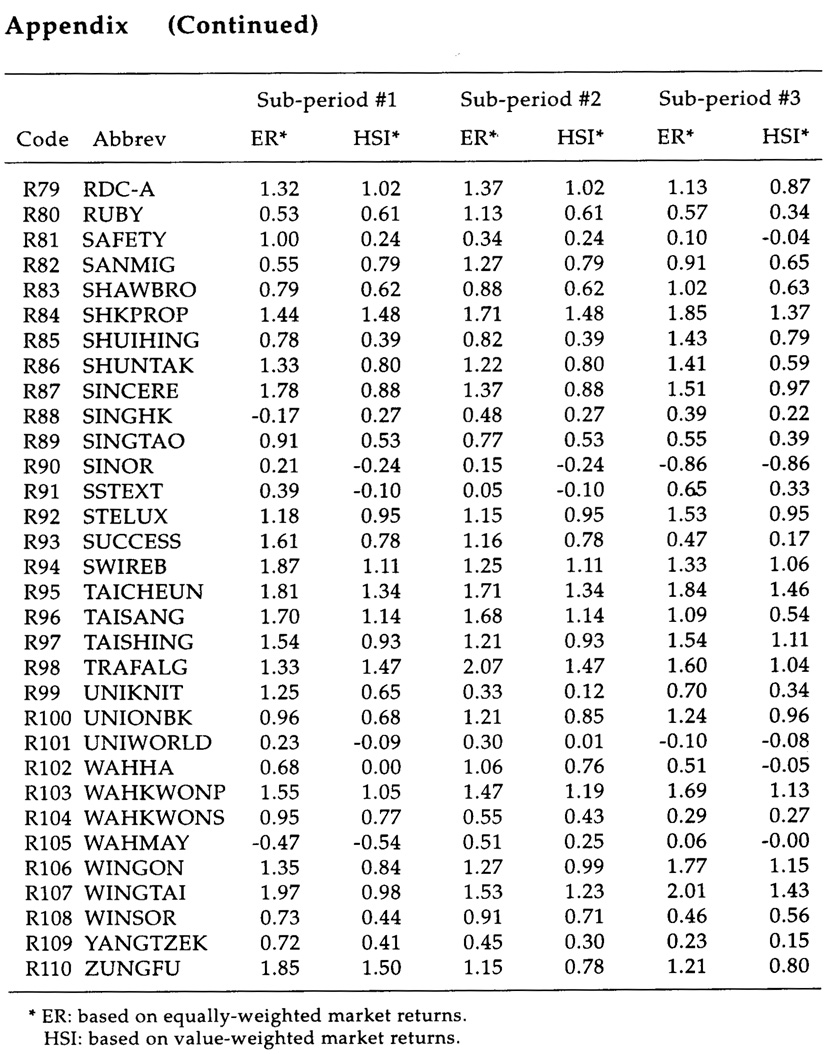
Beta values of securities are estimated for the three sub-periods based on the Market Model equation. Two proxies for market returns are used -- an equally-weighted market return (EW) and a value-weighted market return (VW). A de-scriptive summary of beta values appears in Table 2 and the values of beta esti-mates for individual stocks are summarized in the Appendix. It can be observed that the beta value of a stock changes from sub-period to sub-period, i.e., it is not intertemporally stationary. Tam designed some statistical tests for intertemporal stationarity and concluded that the latter assumption for risk proxies cannot be accepted for Hong Kong stocks in the period under investigation.7 When VW is used, the mean beta value ranges from 0.63 to 0.69 with a standard deviation of 0.45. The beta value of the investment opportunity set should be one. The less than unity average beta value can be attributed to two factors. First, a "survivorship" bias in the sample because only those large firms for which 14 years of continuous data exist have been considered. Second, a downward bias caused by lags in price adjustment to changes in market levels. This may be due to thin trading or other forms of market inefficiency. Ma and Tam, in an earlier pa-per, proved that stock prices in Hong Kong followed a Moving Average process of the type MA(1,1), i.e., a non-random process, which is quite contrary to what has been observed in the New York and other large markets.8 In other words, price adjustment may lag behind the announcement of news by a month or more. When EW is used, the mean beta value ranges from 0.98 to 0.99, just slightly below one. Beta estimates are therefore sensitive to the choice of the market proxy used.
Fowler and Rorke have demonstrated that thin trading can introduce bias into both security and market index returns, which will consequently lead to biased and inconsistent estimates of the market model parameters.9 Scholes and Williams10 and Dimson11 offer other procedures to improve the estimates of beta.
Beta estimates based on the equally-weighted market returns are preferred in order to minimize the downward bias. In fact, most researchers in the past have used EW in the estimation of beta values. The maximum value of beta ranges from 2.09 in the second sub-period to 2.38 in the first. Property stocks in general have high betavalues, whereas finance and utility stocks have betas less than one. The average co-efficient of determination R2 of the Ordinary Least Square procedure to estimate be-tas is 0.57 for Index stocks and 0.41 for non-Index stocks. The low R2 may be caused by stock price measurement error due to price adjustment lags. R2 of the Market Model equation can be interpreted as the proportion of total risk which is systematic or market-linked; this part cannot be eliminated by diversification. The proportion of total risk that is unsystematic or due to stock-specific characteristics is therefore (1 - R2) or about 51 percent; this can be reduced or eliminated by diversification. R2 was found to be 0.60 by Mok, Lam, and Cheung12 for the 37 blue chips that made up the Hong Kong Index for the period 1980-1989. Only a small number of securities have negative beta values. Theoretically, all beta values must be positive, as all capital assets should have some positive correlation with the market portfolio.
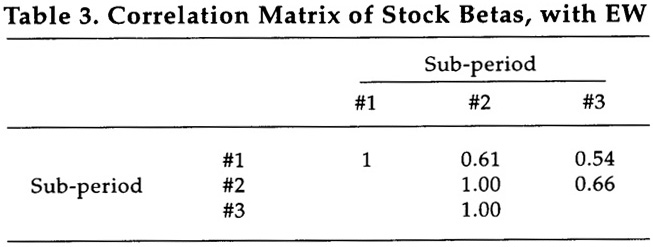
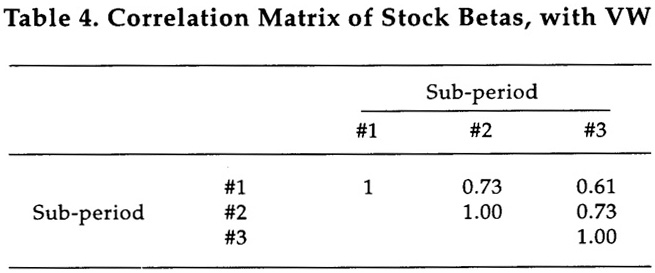
The average correlation among sets of beta values in the three sub-periods is only 0.60 when EW is used to estimate them; this is far from satisfactory for intertemporal stationarity to occur. Refer to Tables 3 and 4.
The beta value of a stock may change gradually over time because of changes in leverage, product line, management, labour-management relations, and so on. However, the stationarity of beta values is almost always assumed in portfolio management decisions, i.e., betas estimated using ex post data are used to predict
 the ex ante return-risk relationship. Portfolio betas have been found to be much more stationary and predictable than individual stock betas. Tam found that secu-rity betas were stationary over 3-year periods on the Toronto Stock Exchange. Jensen13 found a correlation of 0.7 for mutual fund betas. An "adjusted" beta was suggested by Blume and Hamada.14 Rosenberg15 even designed a model to esti-mate beta using accounting variables alone. Fabozzi and Francis16 found that be-tas obtained by using the OLS method appeared as "random coefficients", and could not be assumed to be stationary over time. Blume and Mok, Lam and Cheung discovered that the security beta in one period was a poor predictor of the corre-sponding beta in the subsequent period.17 Stationarity will improve if more secu-rities are included in portfolio formation. Portfolio returns should therefore be used instead of individual security returns in testing any return-beta relationship.
In the CAPM context, beta measures the amount of systematic risk in the asset. Assuming that the investor diversifies his portfolio so as to eliminate the unsystematic risk, beta represents the only risk upon which a compensation can be expected. The higher the risk is as measured by beta, the higher will be the expected return. This relationship is positive and linear, according to the model.
Roll argued that asset return was an exact linear relation of its beta only if the latter was estimated by using an efficient market portfolio.18 But what is an effi-cient market portfolio in Hong Kong? The answer is at least as theoretical as the question. The efficient market portfolio should consist of the available investment opportunity set whose components are weighted with respect to their market val-ues at that time. Given the free flow of capital and the internationalisation of the Hong Kong capital market, such an investment opportunity set is impossible to define in practice.
Limitations of Beta Estimates
[1.] Thin-trading Problem (or Intervalling Effect) Scholes, Williams, Dimson and Marsh argued that OLS-betas for thin-trading stocks are likely to be biased downwards since returns of these stocks tend to be less synchronized with the market returns.19
In a study of beta stability on the Helsinki Stock Exchange in Finland, Berglund, Liljeblom and Loflund found that none of the correcting measures so far suggested by researchers could much improve the stability of the OLS-betas.20 More research in the area of thin trading in small markets is called for before one should use more complicated beta-estimated techniques for marginal gain in beta accuracy. As a re-sult, no measure will be taken to correct the thin trading problem in the present sample, except for the fact that portfolio monthly returns will be used.
[2.] Lack of diversity in security groups: A number of industries are not well represented on the Hong Kong Stock Market -- such as toys, garments and tex-tiles, restaurants, retailers, and (believe it or not) massage parlours and steam baths.
[3.] Family Control: Many firms demonstrate high correlation in their price movements because they are controlled by the same family. Interlocking of con-trol is also popular, e.g., HK Land and Jardines each control about 25 percent of each other. Not only multi-collinearity is a problem; real investors' diversification is also impossible as firms may somehow be directly or indirectly controlled by the same family or related families.
[4.] The statistical problem of homoscedasticity may occur because investors do not take full advantage of diversification.
[5.] One also wonders whether the Hang Seng Index is an efficient proxy for the Market Portfolio. The Stock Index has been challenged by Roll and others to be an inefficient proxy of the theoretical Market Portfolio; this problem is even more severe in a smaller market.
Many assets in Hong Kong are not "marketable". According to Tam and Schippers, the backbone of the local economy is small and medium-sized firms.12 For instance, in 1985, only 0.5 percent of total establishments in Hong Kong hired more than 500 workers and about 27 percent of them hired from 1 to 4 workers. The efficiency or the representation of the Market Proxy is therefore in serious doubt.
[6.] Some Hong Kong and Macau people love gambling -- horses, hounds, mahjong, from lottery tickets to full-scale casinos. The classical risk-return rela-tionship of Markowitz and Sharpe/Lintner depends very much on the assump-tion that investors are risk-averse. When you have a lot of investors who are risk-takers, that classical relationship is under severe challenge.
Applications of Betas
Beta has long been used as a risk proxy for estimating expected returns. Many other uses have been suggested, such as approving the rate charged by utility companies, establishing the cost of equity capital in a firm, and identifying underpriced and overpriced stocks (see Harrington).22 However, investors must use these betas cautiously in the Hong Kong Stock Market as they do not seem to be stationary over time. In a dynamic economy such as Hong Kong's, we do ex-pect the risk characteristics of a firm to change quite rapidly.
Notes
1 H. Markowitz, "Portfolio Selection," Journal of Finance 6 (1952): 77 - 91 and Portfolio Selection, (New York: John Wiley and Sons, 1959).
2 W. F. Sharpe, "A Simplified Approach for Portfolio Analysis," Management Sciences 9 (1963): 227 - 293 and "Capital Asset Prices: A Theory of Market Equilib-rium under Conditions of Risk," Journal of Finance, 19.3 (September 1964): 425 - 442.
3 E. F. Fama, "Risk, Return, and Equilibrium," Journal of Political Economy (Feb-ruary 1971): 30 - 55 and "A Note on the Market Model and the Two-Parameter Model," Journal of Finance 28 (1973): 1181 - 1185 and Foundations of Finance (New York: Basic Books, 1976).
4 M. E. Blume, "Portfolio Theory: A Step Towards its Practical Applications," Journal of Business 43 (1970): 153 - 173 and "On the Assessment of Risk," Journal of Finance 26.1 (1971): 1 - 10.
5 J. Evans and S. H. Archer, "Diversification and the Reduction of Dispersion: an Empirical Analysis," Journal of Finance, (December 1968).
6 J. Lintner, "Security Prices, Risk, and Maximal Gains from Diversification," Journal of Finance 20. 4 (1965): 587 - 616. Also see sharpe, op. cit.
7 Anthony C. W. Tam, "Stationarity of Beta Coefficients in Canada," Uupublished M. B. A. Thesis, Faculty of Business Administration, University of Alberta, 1981 and "Testing the Assumptions of the Capital Asset Pricing Model and the Arbitrage Pricing Model in the Hong Kong Stock Exchange," in The Third International Conference on Asian-Pacific Financial Markets: Proceedings of the Confer-ence in Singapore, Septebmer 8-11, 1993, by the National University of Singapore, 1993, 363 - 376 and "Empirical Evidence of Capital Asset Pricing Model in the Hong Kong Stock Market," in The Second Annual Conference on the Theories and Prac-tices of Security and Financial Markets: Proceedings of the Conference in Kaohsiung, Taiwan, December 18-19, 1993, by the Institute of Finance, National Sun Yat-sun University, 1993, 190 - 202 and Management Practices in the Pearl River Delta co-authored by F. Schippers Hong Kong: API Press, 1990).
8 Chi Ma and Anthony C. W. Tam, "Time-Series Study of Hong Kong Stock Returns," in Problems and Prospects in International Business -- Perspectives from Asia and the Pacific: Proceedings of the Conference in Brisbane, Australia, June 21-24 1992, by the Academy of International Business, Griffith University and the University of Southern Queensland, 1992, 366 - 371.
9 D. J. Fowler, and C. H. Rorke, "Thin Trading and Parameter Estimation in the Market Model: an Analysis and Review," Working Paper, Faculty of Manage-ment, McGill University, No. 79 - 50, 1979.
10 M. Scholes, and J. Williams, "Estimating Betas from Nonsynchronous Data," Journal of Financial Economics 5 (1977): 309 - 327.
11 E. Dimson, "Risk Measurement When Shares Are Subject to Infrequent Trad-ing," Journal of Financial Economics, 7 (1979): 197-226 and E. Dimson and P. R. Marsh, "The Stability of UK Risk Measures and The Problem of Thin Trading," Journal of Finance 38. 3(1983): 753 - 781.
12 H. Mok, K. Lam, and I. Cheung, "An Exploration on Risk and Return of Hong Kong Stocks," The Securities Journal (February 1990).
13 M. C. Jensen, "Risk, The Pricing of Capital Assets, and the Evaluation of Investment Portfolios," Journal of Business 42 (1969): 167 - 247.
14 R. Hamada, "The Effect of the Firm's Capital Structure on the Systematic Risk of Common Stocks," Journal of Finance (May 1972): 435 - 452. Also see Blume,op. cit.
15 B. Rosenberg, "Prediction of Common Stock Betas," Journal of Portfolio Man-agement (Winter 1985): 5 - 14.
16 F. J. Fabozzi, and J. C. Francis, "Beta as a Random Coefficient," Journal of Financial and Quantitative Analysis (March 1978): 101 - 117.
17 M. E. Blume, op. cit. Also see H. Mok, K. Lam, and I. Cheung, op. cit.
18 R. Roll, "A Critique of the Asset Pricing Theory's Tests, Part 1: On Past and Potential Testability of the Theory," Journal of Financial Economics 4 (1977): 129 -176.
19 M. Scholes and J. Williams, op. cit. Also see E. Dimson and P. R. Marsh, op. cit.
20 T. Berglund, E. Liljeblom, and A. Loflund, "Estimating Betas on Daily Data for a Small Stock Market," Journal of Banking and Finance 13 (1989): 41 - 64.
21 See Note 7.
22 D. R. Harrington, "Whose Beta is Best?" Financial Analyst Journal (August 1983): 67 - 73.